Ladder
Updated on 2025-11-07Selection Choice
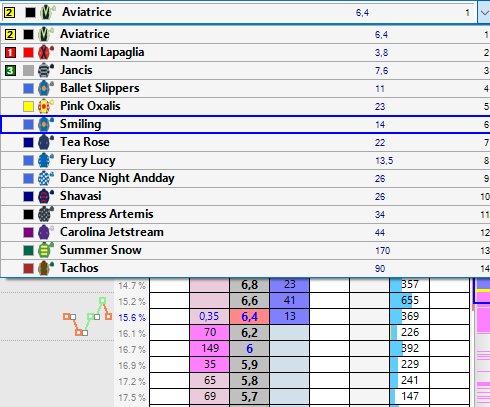
At the header of the ladder, the name of the market selection to which the book table refers is displayed. Using the dropdown menu, you can choose to view the ladder for any of the other available selections.
Each selection is color-coded for easy identification. The colors can be customized in the Options window, Colors tab. When trading with horse racing, the colours used are those returned by Betfair, if available.
Selections Order
The order in which market selections appear from left to right when the market window opens can be configured using the Options window, Ladder tab, or with a simple click from the menu in the bottom button bar of the market window. For example, you can sort the selections based on the order established by Betfair or based on odds.
You can swap two ladders by dragging and dropping them, holding down the left mouse button, into the area indicated by a cross below.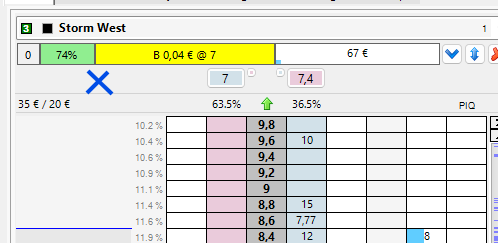
Searching for a specific selection
Right-clicking on the selection list allows you to search by name. This feature is particularly useful for markets with numerous selections. An example is golf, where the winning market has a long list of participants.
Information in the Selection List
In addition to the selection's name, various related information is displayed.
The small number inside a colored box to the left of the selection's name indicates its position according to a sorting criterion based on favorite (e.g., a 1 means that particular selection is the market favorite), while the small number at the far right of the name's box indicates its position according to Betfair's sorting criterion.
The number of closed bets and the number of open bets on the selection in question are also displayed, if available.
If the corresponding option is selected in the program configuration, the last traded odds for the selection will be displayed next to each name when the list opens.
First Row of Ladder Table Header
The row below contains a series of very useful data and buttons during betting and trading.
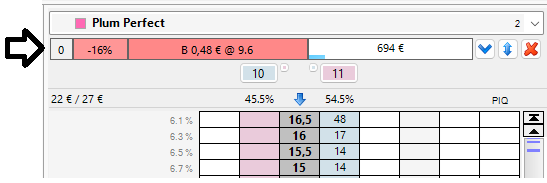
Starting from the left, the first box indicates our position with respect to the trade on this selection: if the value 0 is present, it means we have no open trades; if the letter "P" is indicated, it means our trade is open as a Back position; if the letter "B" is indicated, it means our trade is open as a Lay position; and if the letter "E" is indicated, it means our trade is closed and we have an Equalized position.
The second box shows the value expressed as a percentage of the Weight of Money: more details on what the WoM is and how it is calculated by Betting Toolkit can be found in the Options chapter.
Continuing to the right, we find the box that provides the value of the Last Traded Odds, the price, or how much money was matched, and whether it was a Lay (letter "B") or a Back (letter "P").
The last box shows the total volume of trades made for that selection, expressed in euros.
Data shown in first row can be chosen in Options Windows, tab Ladder, where you can also give a priority order at those informations, so that when the ladder is reduced only most useful data is displayed.
There are four buttons at the end of the first row:
- Apply Strategy to Selection
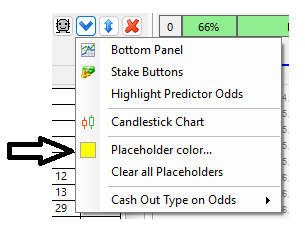
This button is only available if a selection strategy has been configured as the default and allows you to apply the strategy to the current ladder selection. - Ladder options menu with:
- Toggle Bottom Panel (see below for a description)
- Toggle default stakes buttons.
- Highlight Predictor Odds: Available only for soccer events, it allows you to highlight the predicted odds in the Predictor panel on the ladder.
- Candlestick Chart: To quickly recall the selection's candlestick chart.
- Placeholder Color and command to clear all Placeholders.
- Horse Information: Available only for Horse Racing events.
- Choice of Cash Out type based on odds. - Center Ladder
Moves the part of the book containing the best back and lay odds to the center of the ladder. - Delete all bets placed on the specific selection but not yet matched with a single click. This cancellation includes all trading activity related to the selection, i.e. both backing and laying positions in the market, as well as any pending stop losses.
Second Row of Ladder Table Header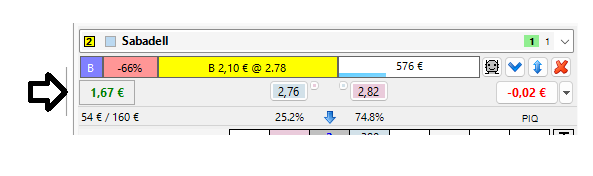
Moving down, we find a row composed of several buttons.
- Profit/Loss Button: Indicates the profit/loss that would be obtained in the current situation if the selection in question were to win. If the odds available on the book allow it, this button is clickable and allows you to quickly clear the profit on the selection, or perform the operation commonly referred to as Void. Left-clicking on this button displays a confirmation window if the "Show confirmation window for clearing profit on selection" option is active in Options / Cash Out.
- Cash Out Button: On the right, a button, which may or may not be visible depending on trading conditions, indicates the potential cashout and allows you to perform this operation once clicked. After clicking, a confirmation window appears if the "Show cashout confirmation window" option in the Options window is selected. By right-clicking this button, you can set Automatic Cashout.
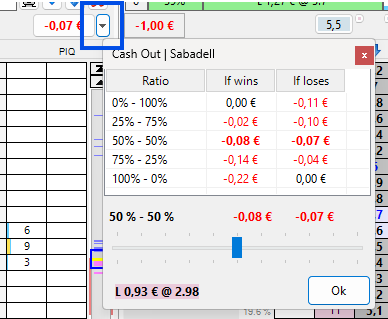
- Proportional Cash Out Button: Next to the Cash Out button, a small button with a downward-pointing arrow opens the Proportional Cash Out management window. This window allows you to quickly select the percentage by which to divide profits (or losses) on the selections relative to the bets placed on that selection. For markets with only two selections (for example, Under/Over markets), this feature allows you to distribute profits and losses across the two selections for all bets in the market. For this feature, the cash out rate is always the current rate available on the bookmaker.
- Best Odds Button: in the center, there are two clickable cells with clickable squares next to them. The value in the blue cell represents the best Back price; clicking it, Betting Toolkit will place a Back bet that will be immediately or partially matched. The square next to it places a Lay bet in front of the best Back price, making us the first to offer the best price. The value in the pink cell represents the best Lay price; clicking it, Betting Toolkit will place a Lay bet that will be immediately or partially matched. The square next to it places a Back bet in front of the best Lay price, making us the first to offer the best price.
Third Row of Ladder Table Header
Immediately below, the values expressed in euros represent the total amount of unmatched Lay bets in the market for a specific range of odds and the total amount of unmatched Back bets for a specific range of odds. In Options, Ladder tab, you can set the desired range of odds. These values help assess market trends, which Betting Toolkit expresses on the same row both as percentages and graphically with a green arrow if it is rising or a blue arrow if it is falling.
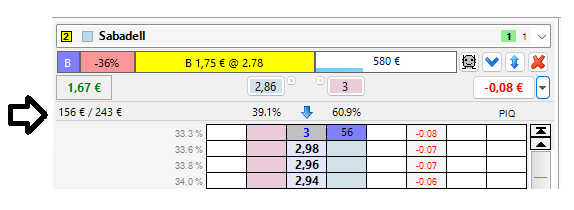
Ladder Table
The structure of the Betting Toolkit ladder is composed of 8 columns. Some of these columns may or may not be present depending on the configuration adopted in the Options window.- Odds and Available Money Columns
The third column lists the odds. To the left of the odds column (pink) is the money available to match Back bets, and to the right (blue) is the money available to match Lay bets. All cells immediately to the left and right of the odds column are clickable, allowing you to place your bets there. Trading with the Ladder table. - Bet Columns
The amount of money used for your unmatched Lay bet is shown in the 1st column at the chosen odds, while the money used for your unmatched Back bet is shown in the 5th column. - Cash Out Column
After your bet is matched or partially matched, the 6th column shows the potential profit or loss for each odds level. Clicking the cell corresponding to the desired profit or loss value, Betting Toolkit will pre-calculate the stake and place a bet (Back or Lay) to achieve that profit or loss value if fully matched. Behavior based on mouse buttons: left-clicking starts the cash-out operation silently or with a confirmation window depending on the "Show confirmation window for cash out" option in the Options window's Cash Out tab. Right-clicking forces the confirmation window regardless of the above setting. - Volume Column
The values in euros in the 7th column represent the volume of money already traded for each odds level. - PIQ Column
The 8th and last column is dedicated to PIQ (Position In Queue), showing the position of your Back or Lay order in the queue before it is executed.
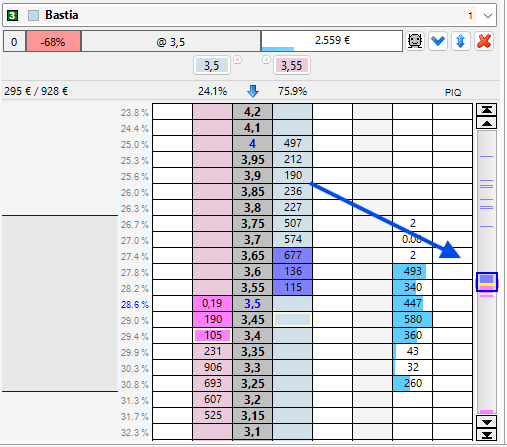
Ladder Odds Chart
To the left of the first column, for each odds level, the pre-calculated probability percentage value and its graph are dynamically drawn by Betting Toolkit based on the traded odds over time. The program also outlines two horizontal lines corresponding to the minimum and maximum peaks reached by the graph, indicating what is known in financial terms as price support and resistance, which in our case are the odds.
Vertical Scroll Bar / Book Map
The book map is displayed within the vertical scroll bar.
The book map represents the entire book as if viewed from above, allowing us to quickly see the distribution of money along the entire odds axis, identify where it is most concentrated, and how it has shifted over time. The yellow line highlights the exact point where the best available back price currently lies. The side bars represent the range of odds in which trades have taken place since the market opened.
Above and below the vertical scroll bar are two pairs of buttons that allow you to move from price to price or to the ends of the book.
Bottom Panel
The bottom panel of the ladder contains four tabs.
- Real-Time Chart: By right-clicking on this chart, you can choose the parameter to display and the time period to display.
- Historical Selection Chart since the market opened. Right-clicking on this chart switches between the odds view and the implied win probability percentage.
- Trades table with a trace of the market trades on the selection.
- Bets table with my current or completed bets. From this table, you can also delete a current bet by clicking the delete button to the right of the row corresponding to an "on the market" bet.
The bottom panel can be detached from the market window by double-clicking on the tab titles.
Placeholders
You can highlight the odds cells with custom colors to create visual placeholders that can be used during trading to see when the market reaches specific targets.
- To add a placeholder, right-click on the odds.
- To delete a placeholder, left-click on the odds.
- To change the highlight color, use the ladder menu shown below: